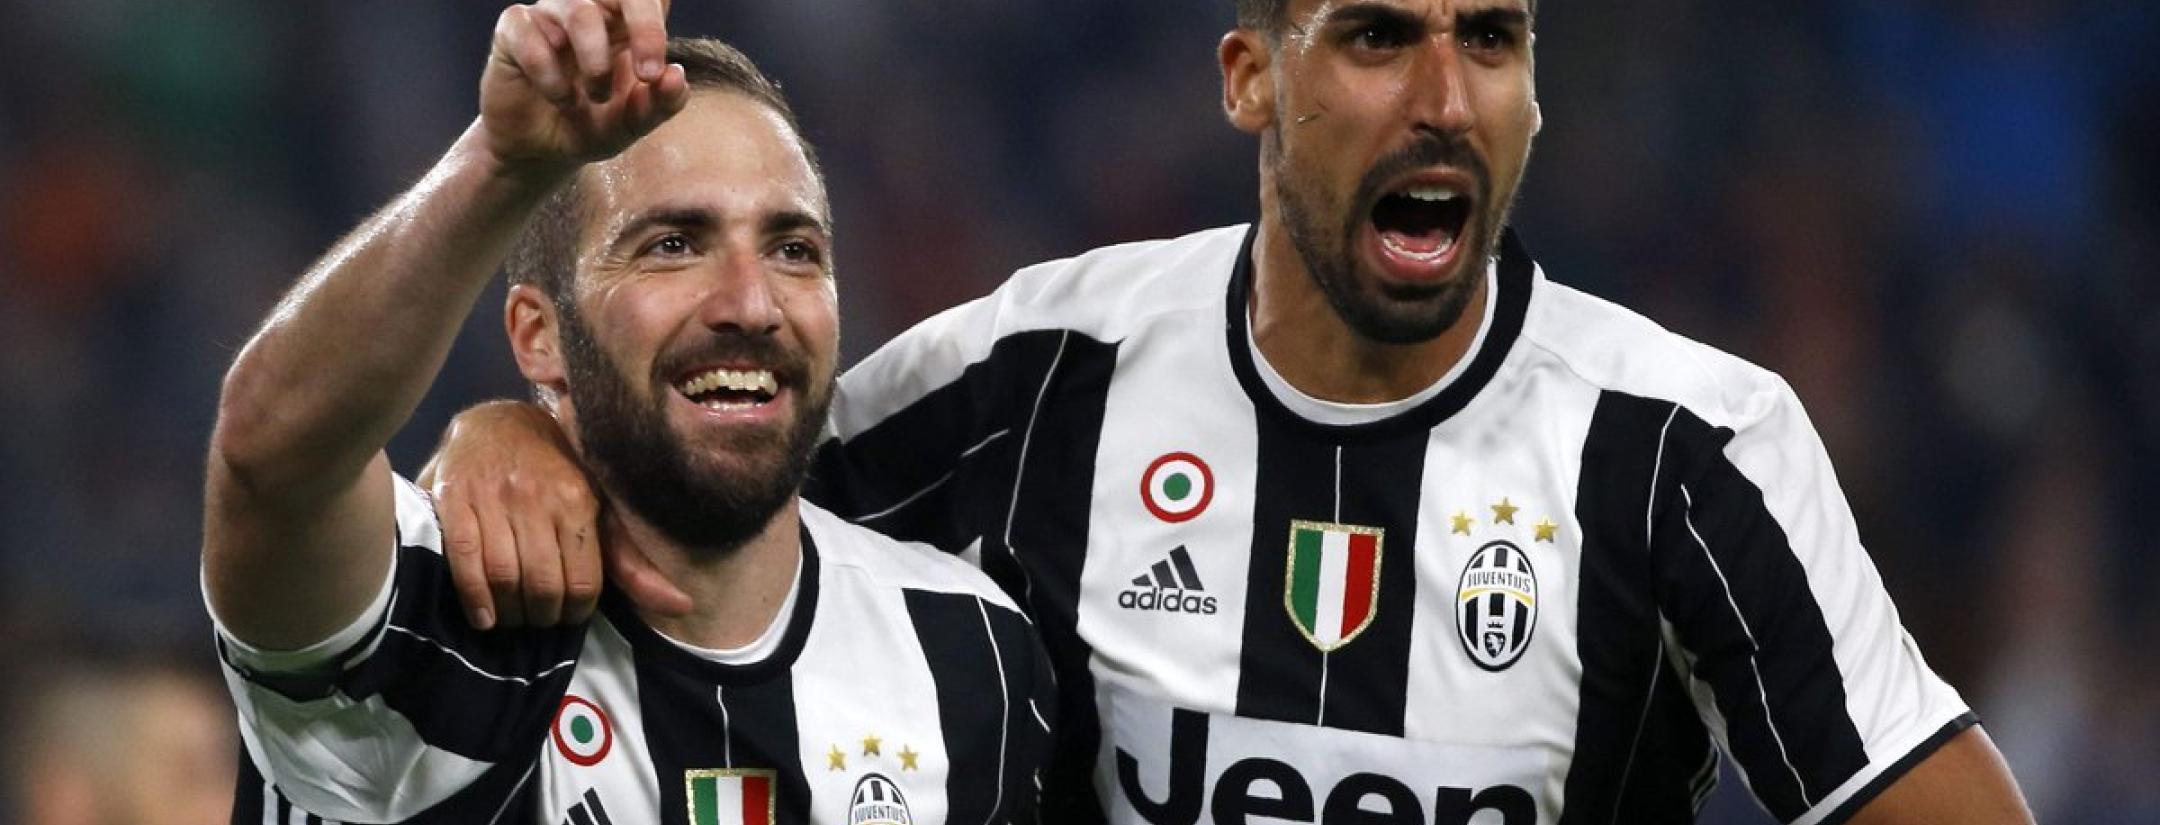
With their 4-1 win on Saturday, Real Madrid took home the Champions League trophy for the second straight time (and third in four years), making them the footballing kings of Europe. In spite of this, they won’t be the team taking home the most prize money from this year’s competition. That title belongs to their final counterparts, Juventus.
The six-time defending champions of Serie A will walk away with €102.3 million compared to Real Madrid’s €89.5 million. We broke down the various allotments for prize money to figure out why the runner up came out as the winners from a fiscal standpoint.
|
Real Madrid |
Juventus |
|
|
Participation |
€12.7 million |
€12.7 million |
|
Group Stage Performance (Teams are given €1.5 million for a win and €500,000 for a draw) |
€6 million (Three wins - three draws) |
€8 million (Five wins - one draw) |
|
Round of 16 |
€6 million |
€6 million |
|
Quarter-Final |
€6.5 million |
€6.5 million |
|
Semi-Final |
€7.5 million |
€7.5 million |
|
Final |
€15.5 million (Champion) |
€11 million (Runner-Up) |
|
Pre-Market Pool Total |
€54.2 million |
€51.7 million |
|
Market Pool |
€35.3 million |
€50.6 million |
|
Post-Market Pool Total |
€89.5 million |
€102.3 million |
UEFA splits the distribution into two separate sections: fixed amounts and variable amounts. The fixed amounts comprise of everything in the above table except for market pool, leaving that payout as the only variable amount. For the 2016/2017 Champions League tournament, a total of €761.9 million was awarded in fixed amounts to the 32 teams participating in the group stage and onward.
As we can see, Real Madrid is slightly ahead in fixed amounts, thanks to their big payout from winning the final, despite the fact that they had a slightly less successful group stage campaign than Juve.
It is clear that Juventus were the big winners in the market pool costs, but we decided to look into why this was the case. Here is where things begin to get a bit more complicated. The overall distribution for market pool this year was €507 million (For anyone counting, that puts the tournament total at just more than €1.2 billion in prize money.)
The way this money is split is based on proportional value of the various television markets. Since the data have not been officially released for the 2016/2017 market pool numbers, we looked at the numbers from last year’s tournament to get a basic ballpark of how much money was available from market share for the Spanish teams, as well as the Italian teams. We can assume that this year’s numbers will be relatively similar to those for last year’s tournament.
In 2015/2016, €79,348,000 was allotted as the market pool for Spain and distributed amongst the four Spanish teams in the tournament. Fifty percent of that total is given based on performance in the previous league season with the champion taking home 40 percent (of that 50 percent given for league performance equaling 20 percent of the total market pool), the runner-up taking 30 percent (15 percent of total market pool), third place taking 20 percent (10 percent of total market pool) and the fourth place team receiving the final 10 percent (five percent of total market pool.)
The remaining 50 percent of the market pool money is given proportionally based on the number of games each team plays in the Champions League tournament. Next, we compared these numbers to those of the Italian market pool.
The total market pool for Italy in 2015/2016 was €100,785,000. Not only was this about €20,000,000 more than the Spanish market pool, but it was only distributed to three teams rather than four. In this case, the first 50% distributed for the league results was split as follows: 45 percent to first place (22.5 percent of total market pool), 35 percent to second place (17.5 percent of total market pool), and 20 percent to third place (10 percent of total market pool.)
As is the case in Spain, the remaining 50 percent of Italy’s market pool was distributed proportionally based on the amount of games the Italian clubs played during the Champions League tournament.
If we look to explain Italy’s advantage in total market pool, we don’t have to look much further than population. While it isn’t the only factor, Spain’s population of 46 million is 75.4 percent of Italy’s 61 million while Spain’s market pool of €79,348,000 is 78.7 percent of Italy’s €100,785,000. This shows that the population of the market can, for some part, explain the differences in the amount of money given to various market pools.
While these numbers are likely to be somewhat different this year than last, the breakdown helps to explain why Juventus ended up with €15.3 million more in market pool money than Real Madrid. No monetary amount is going to fix the heartbreak that Juventus experienced from Saturday’s defeat, but at the very least, the club goes home as the leaders in prize money received from the 2016/2017 edition of Europe’s elite club competition.


