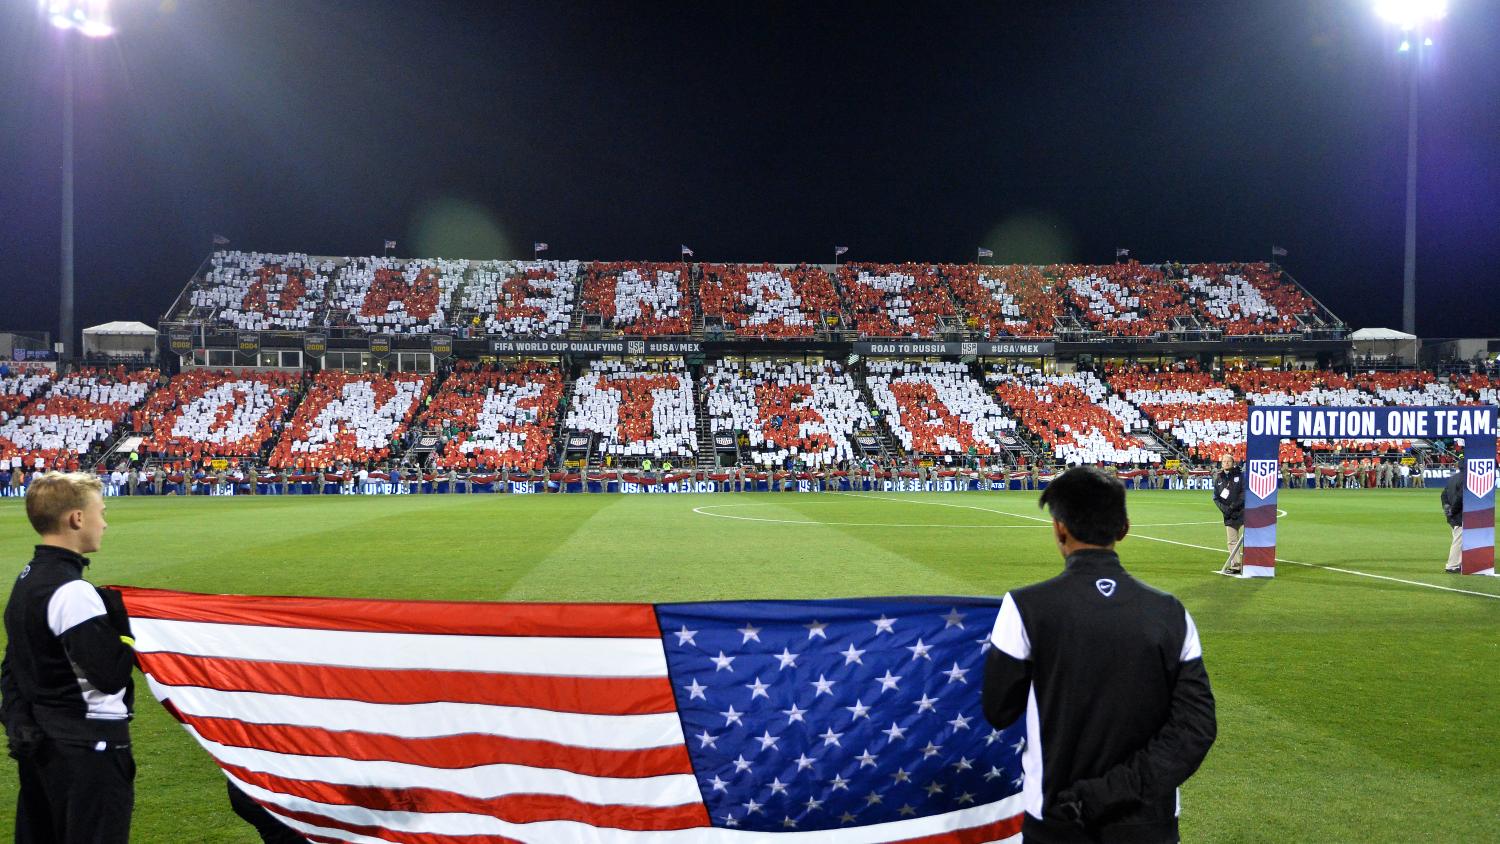
Historically, Columbus, Ohio, has been the premier home fortress for the USMNT, with the Americans winning four of five international matches against Mexico at the home of the Columbus Crew.
All four of these victories have come in the last two decades and all by a 2-0 scoreline, helping to cement the slogan "Dos a Cero" and signaling a new chapter in the history of the once-lopsided rivalry.
The USMNT has played in other cities in Ohio before, with international matches contested in Cincinnati and Cleveland, but Friday's fixture against Mexico in Cincinnati will be the first time that the two sides have played a match in Ohio outside the city of Columbus.
Can the United States' history of success in the state of Ohio continue, or will Mexico claim a rare cold-weather win? And does match location even affect the result of the game?
Home-field advantage is a legitimate factor on match results (studies have shown that home teams win about twice as often as road teams, equal to 50 a percent win rate overall), but for international fixtures, does the specific match location within a country (i.e. Ohio) still hold the same weight?
As a good statistician always says, correlation does not mean causation, so you can draw your own conclusions about the USMNT's record against Mexico in various cities, states, and countries:
Note: Possible Points Won Percentage is like win percentage but giving proper weight to draws. As in competitions, a win is worth three points, a draw worth one point, and a loss worth nothing. So if the USMNT plays three matches in a city, winning one, losing one, and drawing the final won, they would have earned four out of a possible nine points, equal to 44 percent of possible points won.
| USMNT Record Vs Mexico by Location | |||||
| Location | Matches Played | Wins | Losses | Draws | Possible Points Won % |
| Denver, CO | 2 | 2 | 0 | 0 | 100 |
| Nashville, TN | 1 | 1 | 0 | 0 | 100 |
| San Antonio, TX | 1 | 1 | 0 | 0 | 100 |
| Paradise, NV | 1 | 1 | 0 | 0 | 100 |
| Fort Lauderdale, FL | 1 | 1 | 0 | 0 | 100 |
| Columbus, OH | 5 | 4 | 1 | 0 | 80 |
| Glendale, AZ | 2 | 1 | 0 | 1 | 67 |
| Washington DC | 2 | 1 | 0 | 1 | 67 |
| Chicago, IL | 2 | 1 | 1 | 0 | 50 |
| Dallas, TX | 2 | 1 | 1 | 0 |
50 |
| Los Angeles, CA | 9 | 2 | 3 | 4 |
37 |
| East Rutherford, NJ | 3 | 1 | 2 | 0 | 33 |
| Houston, TX | 2 | 0 | 0 | 2 | 33 |
| Philadelphia, PA | 1 | 0 | 0 | 1 | 33 |
| Foxborough, MA | 1 | 0 | 0 | 1 | 33 |
| Pasadena, CA | 5 | 1 | 3 | 1 | 27 |
| San Diego, CA | 1 | 0 | 1 | 0 | 0 |
| Texas | 5 | 2 | 1 | 2 | 53 |
| California | 14 | 2 | 7 | 5 | 31 |
| United States (Total) | 41 | 18 | 12 | 11 | 53 |
| Mexico City | 23 | 1 | 19 | 3 | 9 |
| Mexico (Total) | 27 | 1 | 23 | 3 | 7 |
| Other Countries | 4 | 3 | 1 | 0 | 75 |
| Total | 72 | 22 | 36 | 14 | 37 |


