Wayne Rooney became England’s all-time leading goalscorer earlier this month, but the underwhelming nature in which he did so – a pair of penalties against San Marino and Switzerland – was perhaps a more accurate reflection of how the last 18 months have panned out for Manchester United’s Number 10. By near unanimous consent, Rooney’s career is in decline.
Anecdotally, his first touch is leaden, he’s been hauled off penalty-taking duties for his club and a 19-year-old (albeit a very expensive one) is keeping him out of his supposedly preferred starting position as striker. But the three graphs below paint a much more worrying picture for Rooney, and one that suggests this may not be just a bump in the road.
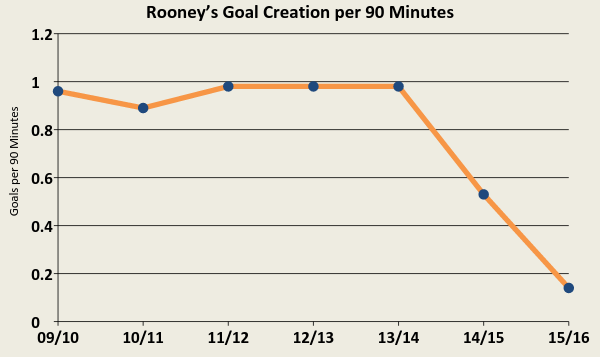
1. Wayne Rooney's Goal Creation Is Plummeting
Rooney’s game has never been about simply scoring. He’s played across the forward line for Manchester United: out wide, up top, as a withdrawn Number 10 and even as a holding midfielder. Wherever he’s found himself, however, Rooney has influenced the game, either through assists or hitting the back of the net himself.
Rooney’s goal creation rate - the number of goals scored or assisted per 90 minutes played - was remarkably consistent until last year, hovering around one goal scored or assisted every 90-or-so minutes played for five straight seasons. As you can see from the graph below, that rate has dropped off a cliff over the last 18 months.

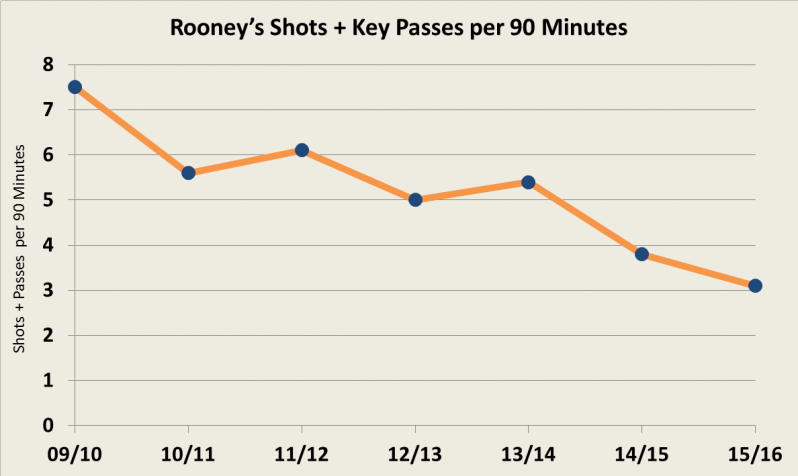
2. He’s Taking Fewer Shots and Making Fewer Key Passes
If one was to play (Red) Devil’s Advocate, it could be argued that Rooney’s goal creation blip was due to some sublime goalkeeping or profligacy on the part of his teammates, not his own shortcomings. But that simply isn’t the case. As the graph below makes clear, both Rooney’s shots per game and key passes per game have nose-dived dramatically since the end of 2013-14.

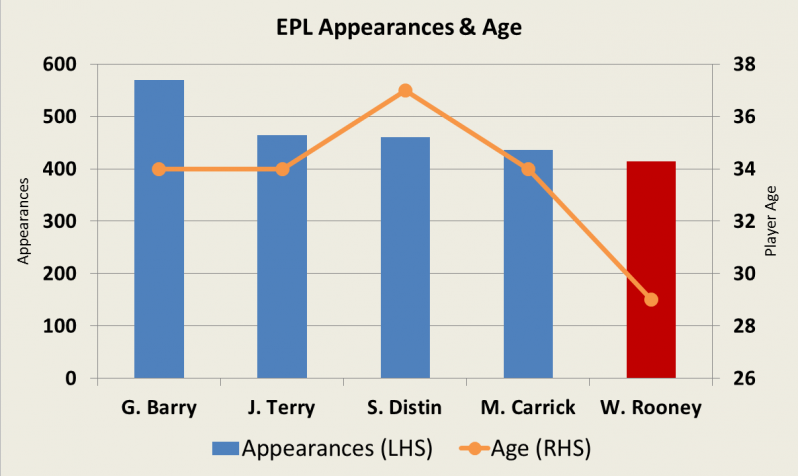
3. Only Four Current Premier League Players Have Made More Appearances
Perhaps the most telling statistic, and one which explains much of what we’ve seen above, is the fact that only four current EPL players have made more Premier League appearances than Wayne Rooney. While he may still be just shy of his 30th birthday, Rooney has already played a career’s worth of football. He made his Premier League debut as a 16-year-old for Everton back in 2002 and hasn’t made fewer than 37 appearances per season (in all competitions) since.

Just look at the age and position of the other currently active EPL players who’ve made the most Premier League appearances: they’re all in their mid-to-late 30s, way past their prime (with the arguable exception of Michael Carrick) and are either defenders or defensive midfielders who've never relied on pace as part of their game. And Wazza's only just behind them. What’s more, Rooney’s actually made 10 more club and country appearances than Carrick and only 16 fewer than the 37-year-old Silvain Distin, who never had to forgo his summer break to play an international tournament.
Such a weight of football, played at the highest level for over 14 years, has blunted United’s Number 10 at a time when, typically, players hit their physical peak. Even though he’s is still to reach his 30s, Wayne Rooney’s best days could very easily be behind him already.


